ENLIL Solar Wind Prediction - Space Weather in 2030
CCMC has compiled the largest catalog of CMEs
with fitted geometric and kinematic parameters from 2010 to the present.
This enables to simulate an outlook on what might be expected in 2030
using 11-years old observations (the same phase of the solar cycle activity)
and future planetary and spacecraft positions.
The animations show:
(1) how violent the heliospheric space weather might be during the early phases of the
NASA Artemis Program
(see also Artemis Program at wikipedia);
(2) how remote observations from future constellation of the STEREO-A, Solar Orbiter, and PUNCH
spacecraft (dedicated to operational space weather monitoring) could be used for "mid-course"
corrections of numerical heliospheric predictions.
Selected animations provide the global context (click on an image to launch the animation):
-
Radial solar wind velocity with the interplanetary magnetic field (IMF) lines at the ecliptic
from 2024-01 to 2024-02.
Positive (negative) IMF polarity is shown by red (blue) at the inner boundary;
HCS is shown by a white line;
IMF lines passing through Earth, STEREO-A, and Solar Orbiter are shown by black-white lines;
and CMEs are outlined by black contours.

-
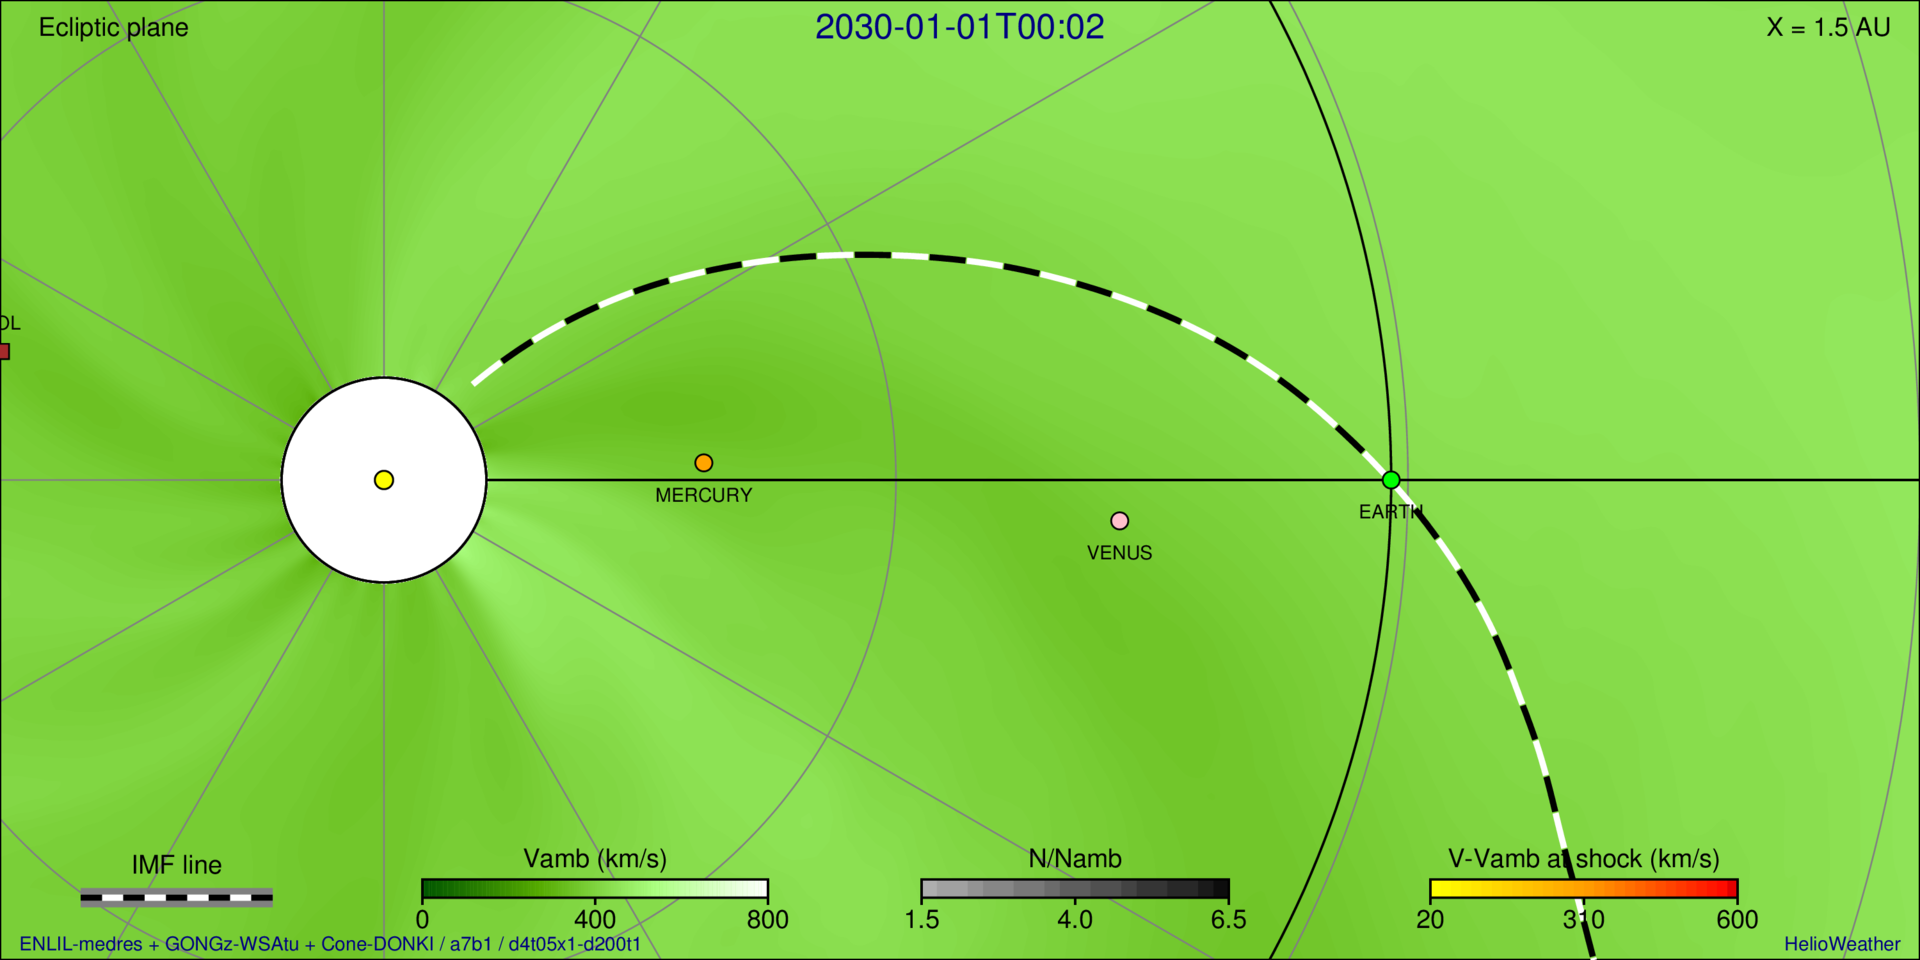
Shock-CMEs alert at the ecliptic from 2030-01 to 2030-02.
IMF lines passing through Earth, STEREO-A, and Solar Orbiter are shown by black-white lines;
background solar wind streams are shown by green shading;
transient density structures are shown by grey shading;
and segments of possible shock-accelerated energetic particles are
shown by yellow-red shading corresponding to shock strength (velocity difference)
along the IMF.

-
Solar wind density with the helio-imagers field of view (FOV) at the ecliptic
from 2024-01 to 2024-02.
positive (negative) IMF polarity is shown by red (blue) at the inner boundary;
HCS is shown by the white line;
and CMEs are outlined by black contours; and combined FOV of heliospheric imagers
and CMEs are outlined by black contours; and FOV of helio-imagers
from Solar Orbiter and PUNCH spacecraft are shown by light-red shading,
light-orange shading, and solid and dashed green lines, respectively.

-
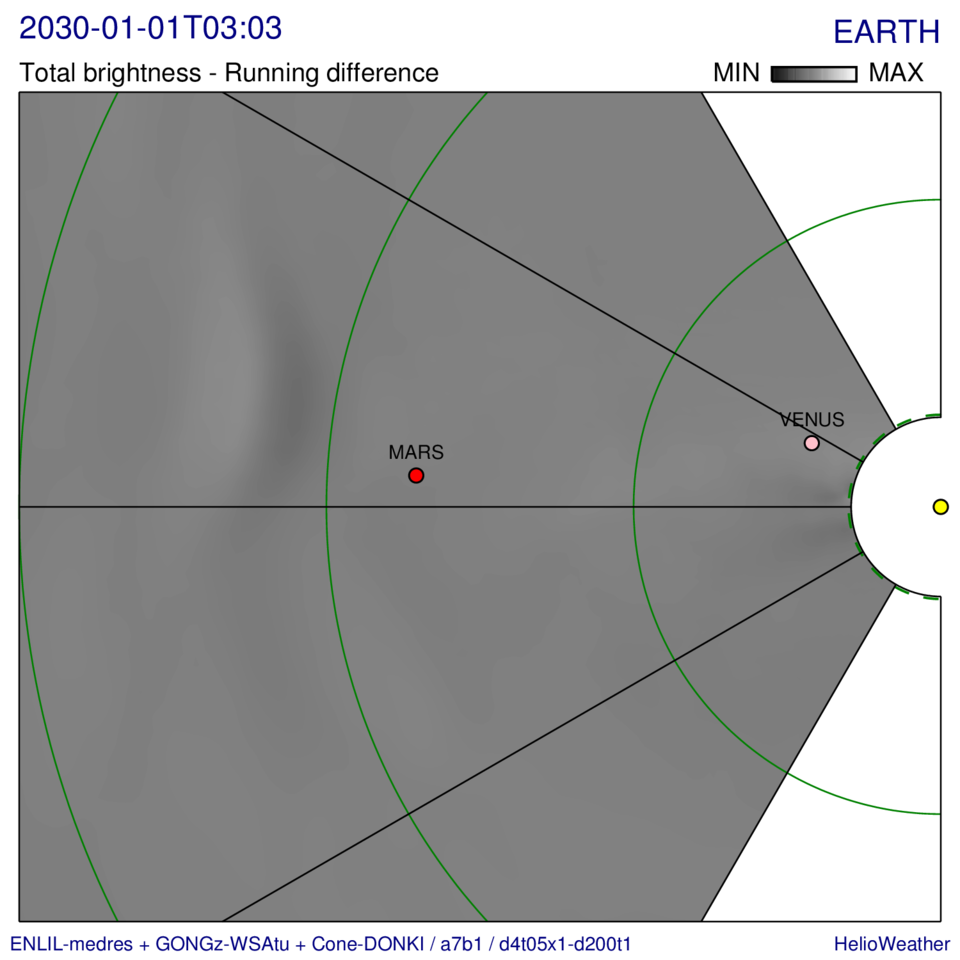
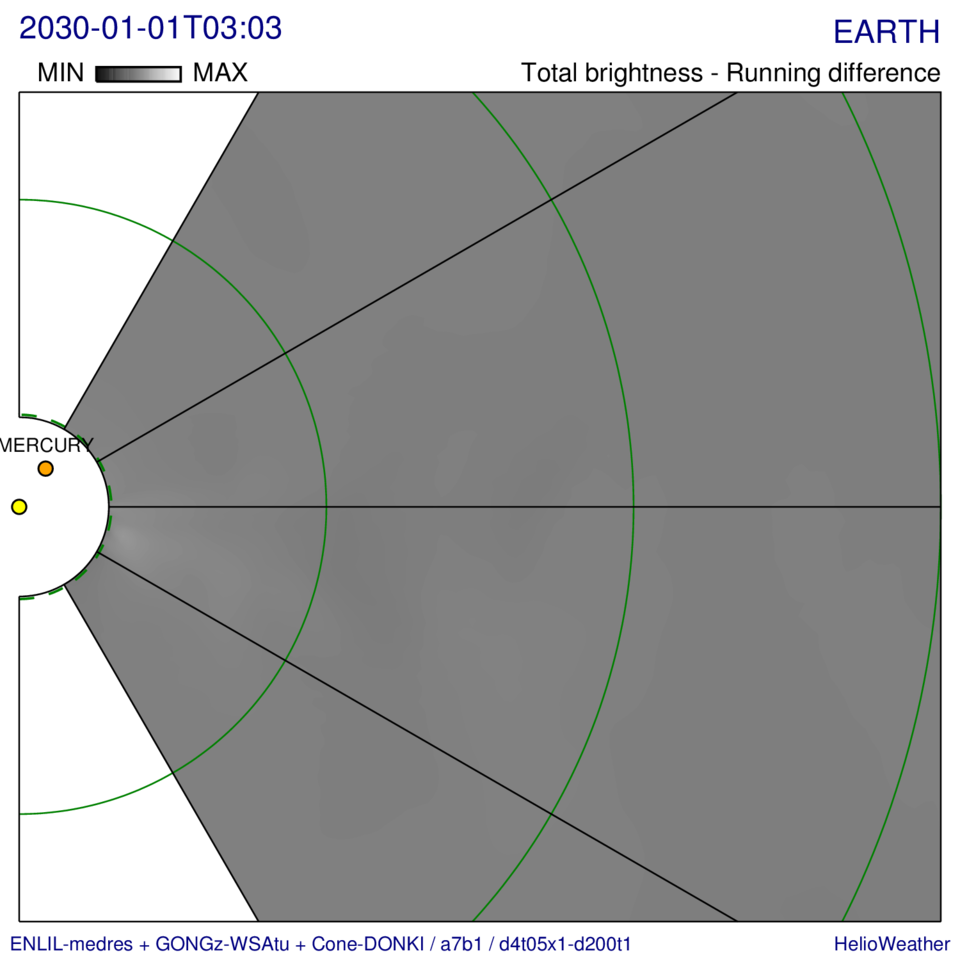
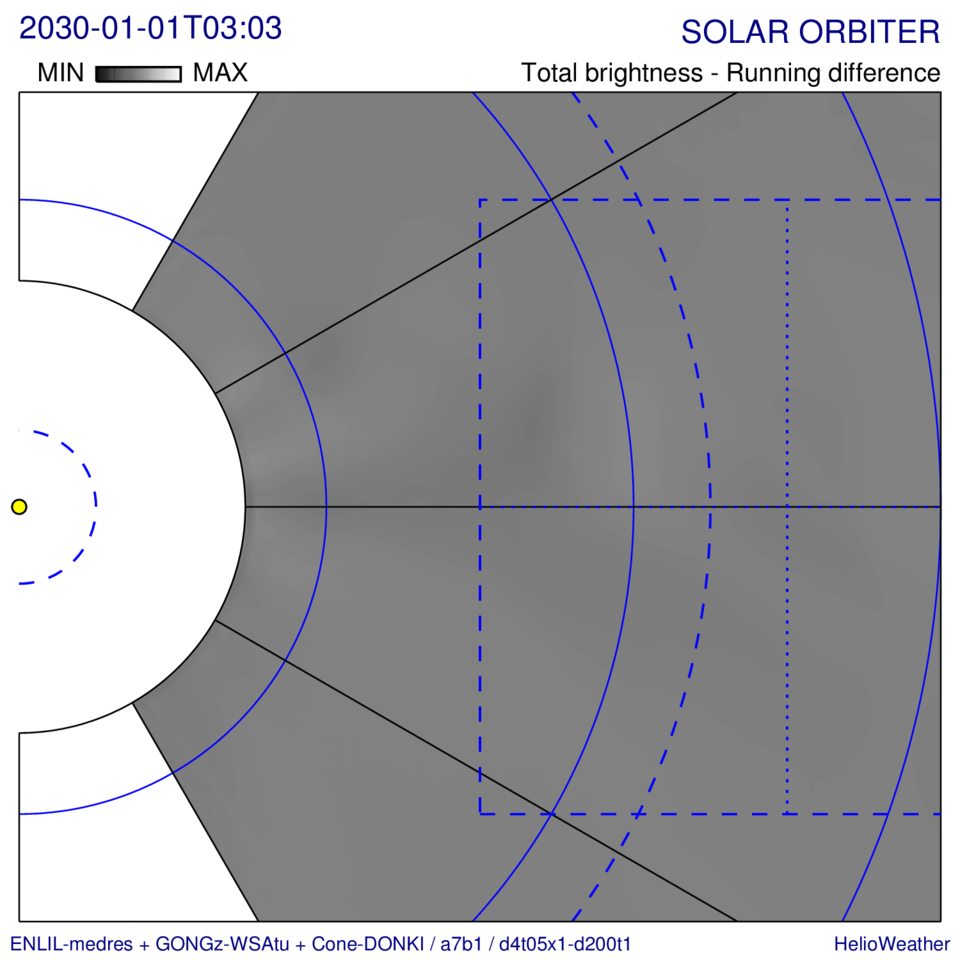
Synthetic white-light images at STEREO-A (left) and Solar Orbiter (right) from 2030-01 to 2030-02.
Solid radial black lines show at -60, -30, 0, 30, and 60 degs aay from the helio-equatorial plane;
solid concentric magenta lines show elevations at 20, 40, and 60 degs;
and dashed magenta lines outline FOV of the heliospheric imagers.


-
Acronyms for the displayed spacecraft positions:
BEP=BepiColombo, PSP=Parker Solar Probe, SOL=Solar Orbiter, STA=STEREO-A, and STB=STEREO-B.
-
Numerical simulations were realized by the 3D MHD heliospheric code ENLIL-2.9
on the medium-resolution grid (2 degs angular spacing)
using the GONGz-WSA2.2 coronal maps with 24-h cadence
and CCMC/DONKI geometric and kinematic parameters.
Please send questions and comments to
Dusan.Odstrcil@gmail.com
at George Mason University (Department of Physics and Astronomy)
and NASA Goddard Space Flight Center (Code 674 Space Weather Laboratory).
Acknowledgments: This work has been supported by NASA/LWS Strategic Capability Program.


